Just pick the winners. That’s the overarching strategy of the Outback Bowl. While seemingly simple, the Outbackers take drastically different paths to arrive at their picks. Until a court or the Grim Reaper cajole me, my proprietary algorithms (with a mixed record of results) will remain a secret. So the sauces will stay secret, but we can decompose the recent batch of picks using several heuristics.
- Pick the Home Team: Home teams win ~55% of NFL games (although home field advantage has generally declined in recent years)
- Fade the Losers: Assume the worst teams really suck
- Load up on Winners: Assume the best teams are really good
- Live (or Die) by the Islands: The island boi life is not for everyone
Pick the Home Team
Historically, Bryant loves the home team, and it’s no different this year. But Bryant is also (narrowly) the worst when picking the home team.
| Oubacker | Hist. Home Picks | Hist. Home Win Rate | 2024 Home Picks |
|---|---|---|---|
| DBB | 75.8% | 58.9% | 71.3% |
| GLG | 62.0% | 59.7% | 63.2% |
| TPP | 61.6% | 61.8% | 57.0% |
| RAS | 57.9% | 60.1% | 55.9% |
Maybe Bryant should keep an open mind to road teams, as he has the highest road hit rate and is the only player to have a better road win rate than home win rate. I’m no road dog, with the worst hit rate on road picks.
| Oubacker | Hist. Road Picks | Hist. Road Win Rate | 2024 Road Picks |
|---|---|---|---|
| DBB | 24.2% | 60.9% | 28.7% |
| GLG | 38.0% | 55.1% | 36.8% |
| TPP | 36.4% | 58.1% | 43.0% |
| RAS | 42.1% | 53.8% | 44.1% |
Fade the Losers
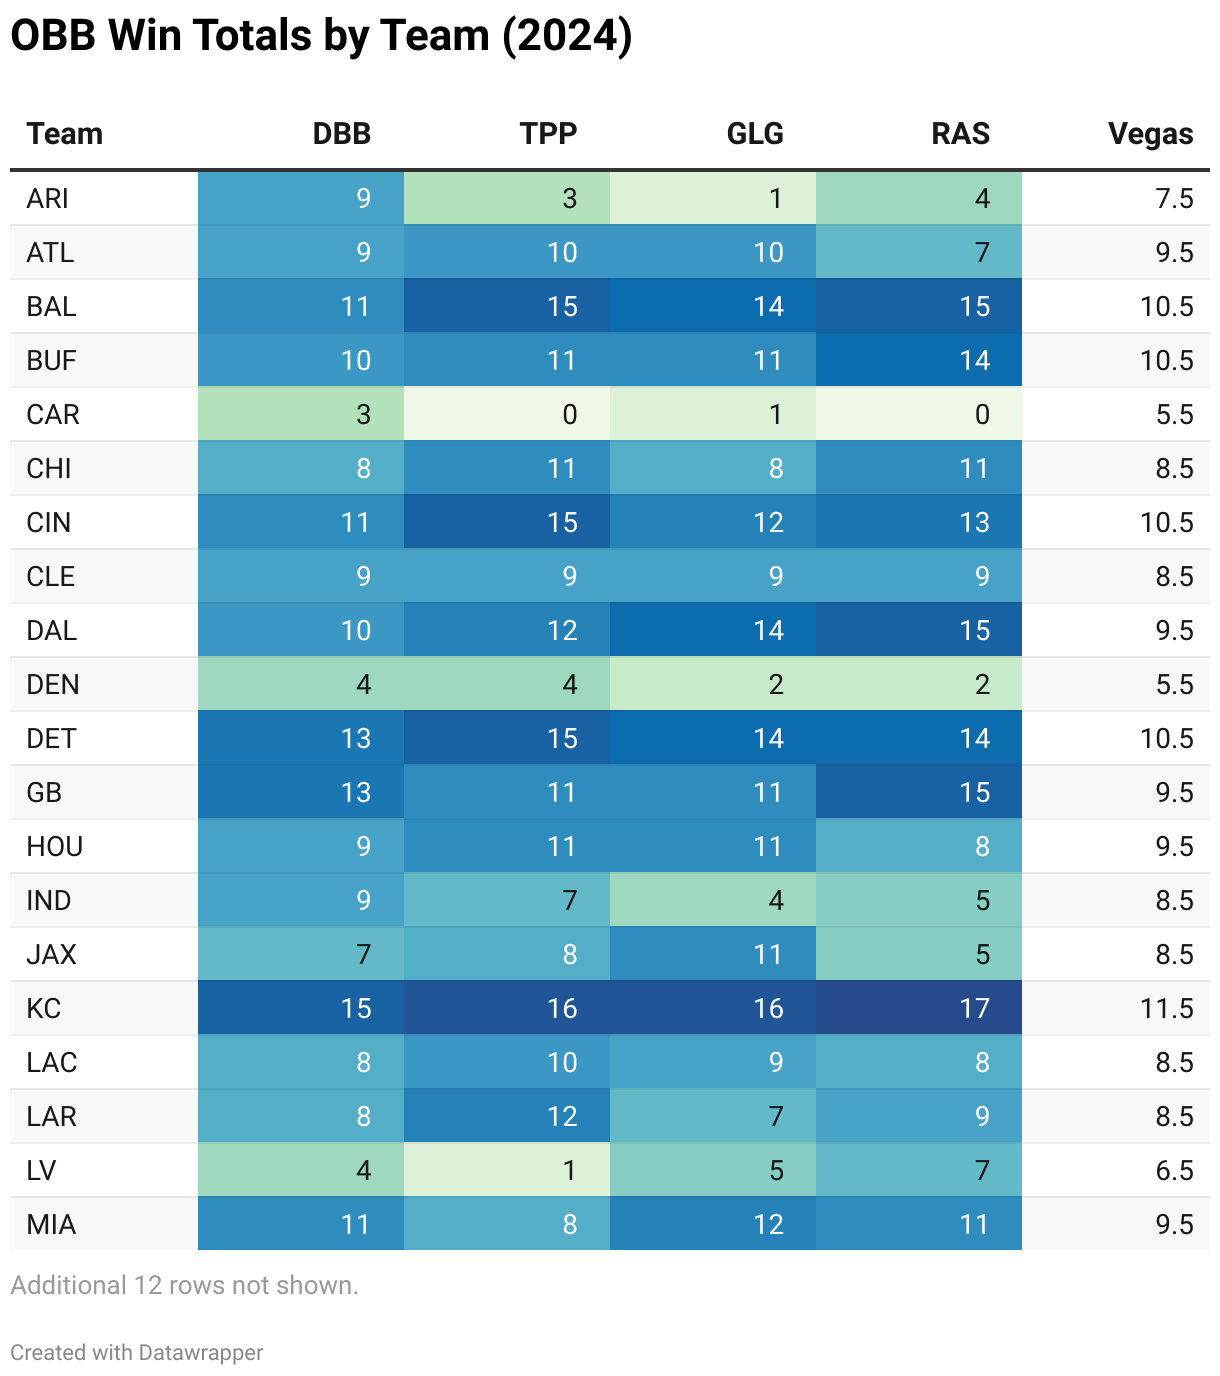
Using ESPN’s latest power rankings, we’ll see who faded the losers the most:
| Team | Power Rank | GLG | TPP | DBB | RAS | Vegas |
|---|---|---|---|---|---|---|
| CAR | 32 | 1 | 0 | 3 | 0 | 5.5 |
| DEN | 31 | 2 | 4 | 4 | 2 | 5.5 |
| NE | 30 | 0 | 0 | 2 | 1 | 4.5 |
| ARI | 29 | 1 | 3 | 9 | 4 | 7.5 |
| WAS | 28 | 3 | 5 | 4 | 1 | 6.5 |
| TOTAL WINS | 7 | 12 | 22 | 8 | 29.5 |
Load up on the Winners
And now the top 5 teams from the power rankings:
| Team | Power Rank | GLG | TPP | DBB | RAS | Vegas |
|---|---|---|---|---|---|---|
| KC | 1 | 16 | 16 | 15 | 17 | 11.5 |
| BAL | 2 | 14 | 15 | 11 | 15 | 10.5 |
| SF | 3 | 16 | 17 | 11 | 16 | 11.5 |
| DET | 4 | 14 | 15 | 13 | 14 | 10.5 |
| PHI | 5 | 15 | 13 | 13 | 10 | 10.5 |
| TOTAL WINS | 75 | 76 | 63 | 72 | 54.5 | |
| 2024 (current) |
Live (or Die) by the Islands
In Outback history, it’s generally been die, as the player with the most islands has come in (or tied for) last every year. Tom rarely finds himself on an island and is the only player with a lifetime positive net on islands.
| Oubacker | Hist. Island Win Rate | Hist. Island % of Games | 2024 Island Picks |
|---|---|---|---|
| TPP | 54.7% | 5.4% | 18 (6.6%) |
| DBB | 50% | 7.3% | 39 (14.3%) |
| RAS | 44.9% | 17.3% | 18 (6.6%) |
| GLG | 37.6% | 7.4% | 7 (2.9%) |
The inverse of the islands – the mainland lifestyle – had become more prevalent. We’ve conformed (all pick the same team) more in recent years, as ~70% of all games have the same pick. But this year is the second lowest rate, with 2018 as only lower season.
| Season | Games with All Same Pick |
|---|---|
| 2018 | 53.2% |
| 2019 | 60.2% |
| 2020 | 64.5% |
| 2021 | 69.9% (nice) |
| 2022 | 72.4% |
| 2023 | 70.2% |
| 2024 (current) | 55.5% |
Here are the pairwise games different for this year.
| Outbackers | GLG | TPP | DBB | RAS |
|---|---|---|---|---|
| GLG | 0 | 49 | 70 | 56 |
| TPP | 49 | 0 | 87 | 59 |
| DBB | 70 | 87 | 0 | 80 |
| RAS | 56 | 59 | 80 | 0 |
Wins by Team
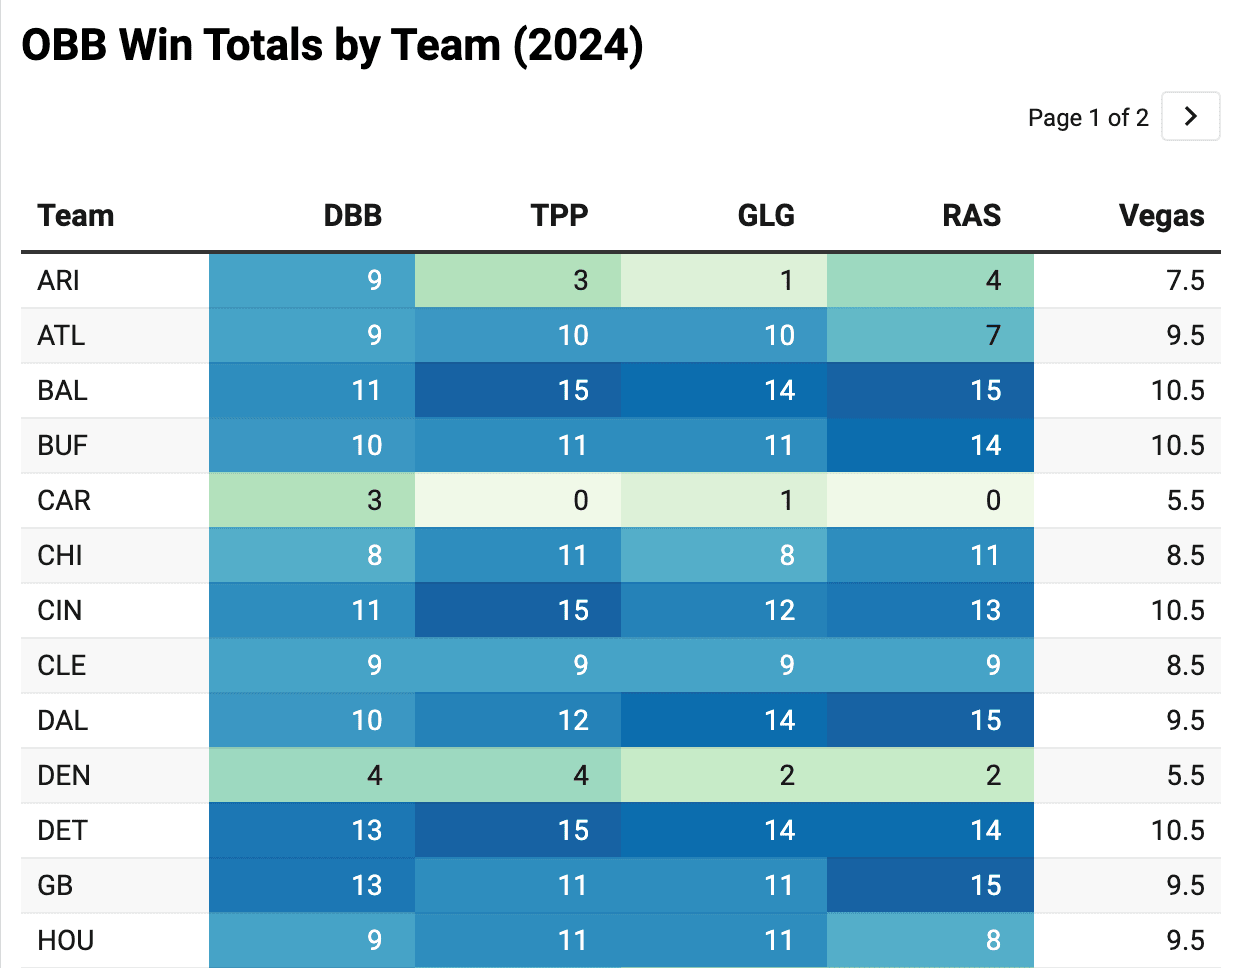
Finally, here are the picks for every team compared to their Vegas win totals.